In this weekly series of articles we use simple statistical analysis to try to determine the times of day when a market is most active, and might offer the best opportunities for intraday traders. This week we’re looking at the Japanese Yen USD/JPY forex pair, studying both volatility and volume to answer the question “when is the best time to trade the Japanese Yen?”
 The Japanese Yen is widely considered to be the second most traded forex pair by volume.
Although the lack of definitive volume data for currency transactions means that no absolute figures are available to support this, there are numerous surveys (such as this one from the SFEMC) of localized interbank markets where the Yen is reported as the second most traded currency after the Euro.
Interestingly, similar reports for forex volume in the London markets (where the greatest daily trading volumes are transacted) place the USD/JPY pair in third place, after the British Pound. This might support the idea that a currency is most heavily traded in it’s “home” market.
Analyzing the Data
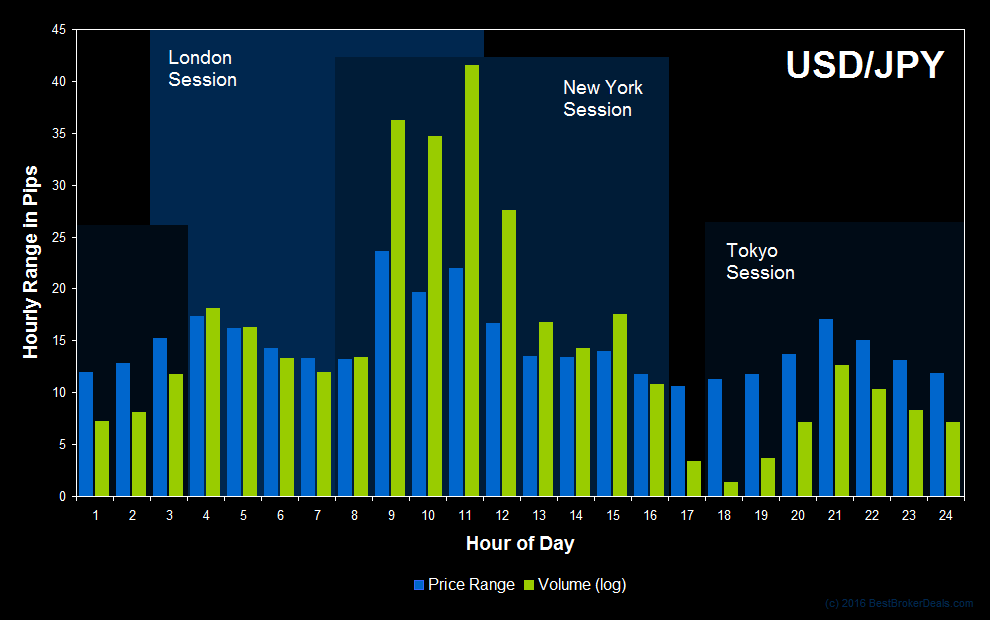
As with all articles in this series, we’ve looked at five years of intraday price data (providing roughly 250 data points for each individual hourly period), and have used quotes from the USD/JPY spot forex market. Volatility is measured simply by hourly range in pips, and all times are EDT. The chart below also includes volume data. This has been taken from the full size Japanese Yen Futures Contract (@JY) which trades on the Chicago Mercantile Exchange, and the data has been scaled to fit with the price data.

The Best Time to Trade the Japanese Yen
The picture here is very similar to what we saw for the Euro last week. The largest hourly price movements occur between 8.00 and 9.00am when the New York markets open, with two lesser peaks in volatility representing the London and East Asia openings. One point worthy of note is that, unlike with the EUR/USD pair, the volatility for USD/JPY is just as high around the East Asian open as it is the London open, suggesting that the “home” market may support the most trading. It will be interesting to see whether this is borne out by analysis of the GBP/USD pair in future weeks.
Once again, it should be remembered that there is overlap between the London and New York sessions, and so the higher volatility and volumes around the the New York open do not mean that more volume is traded exclusively at that location; the volume shown are aggregated by time period alone.

Turning our attention to the volume, it is obvious that there is a strong positive correlation between high volume and high volatility. There also appears to be lower deviation in volatility than volume, suggesting that as trading volumes in the Japanese Yen increase, their ability to move the market does not increase in direct proportion.
Notice the distinct lull in volume around the time the US markets close. This is probably a distinct feature of volume in currency futures and wouldn’t be seen to such an extreme extent if we could see accurate interbank volume data, but it does tell us something interesting . . . During this period the Japanese Yen forex futures continue to track the underlying USD/JPY spot market accurately, and this is due to the actions of arbitrageurs between the two. This gives us some insight into how little of the volume in forex futures is actually attributable to arbitrage with the spot market, and how much the actions of this type of participant are able to move the market without the additional volumes generated by speculators and other participants.
How to Use This Analysis
The great thing about this kind of statistical analysis is that you can incorporate it as part of an automated strategy with strict rules, but you can also use it as one of many inputs in a broader discretionary decision making process. However you trade, information like this should be useful.
Nevertheless, in the investigative spirit of this piece, I would encourage you to carry out your own research so that you can be absolutely confident in the results you see and their relevancy to your own strategies. All the research in this article was completed using TradeStation and the data was presented using Excel, but pretty much any good broker’s charting software will support this type of investigation.
| View the next article in this series: The Best Time to Trade the British Pound |
