In this article, the first of a weekly series where we will aim to identify the best times of day to trade a market, we’re taking a look at the EUR/USD currency pair and asking “when is the best time to trade the euro?”
 The name of the game is to identify the times when this market has historically produced the biggest movements. Being aware of these tendencies is essential if you’re a day trader as you need this volatility in order to profit – overcoming the fees that your broker charges you (commissions and account fees) as well as the costs of trading (spreads and slippage) is difficult; your entry and exit costs are exactly the same as those of a longer term trader but your average profit will be much smaller unless you are able to capture big moves. Knowing when your market is most likely to produce decent size moves is essential.
There are many pieces of wisdom you’ll come across, but it’s not often you’ll see them backed up with hard data. For example: “the greatest trading volumes in forex are transacted around the time of the London open, and this is when the biggest movements occur”. Is this really true? And who’s to say that the greatest volumes are correlated with the greatest volatility? You simply don’t know until you do the analysis and get some objective data, and trading on hearsay is certainly no way to trade.
Analyzing the Data
Without further ado then, let’s proceed with our analysis . . .
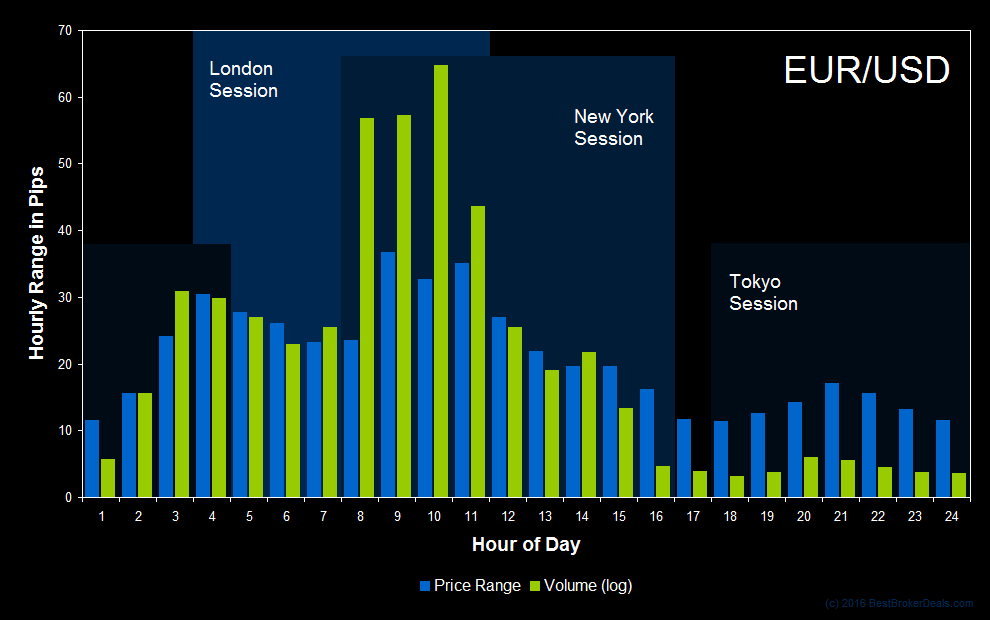
We’ll study five years of intraday price data (providing roughly 250 data points for each individual hourly period), and have used quotes from the EUR/USD spot forex market. Volatility is measured simply by hourly range in pips, and all times are New York Time. The chart below also includes volume data. This has been taken from the full size Euro Futures Contract (@EC) which trades on the Chicago Mercantile Exchange, and the data has been scaled to fit with the price data.

The Best Time to Trade the Euro
From this we can see that the period when this market has traditionally been the most active is around the time of the New York open, when additional volume flows into this market supplementing that from Europe. A clear secondary peak in volatility can be seen around the time of the London open, and then a more modest increase in price movement occurs around the time the East Asian markets become active.
How to Use This Analysis
The great thing about this kind of statistical analysis is that you can incorporate it as part of an automated strategy with strict rules, but you can also use it as one of many inputs in a broader discretionary decision making process. However you trade, information like this should be useful.
Nevertheless, in the investigative spirit of this piece, I would encourage you to carry out your own research so that you can be absolutely confident in the results you see and their relevancy to your own strategies. All the research in this article was completed using TradeStation and the data was presented using Excel, but pretty much any good broker’s charting software will support this type of investigation.
| View the next article in this series: The Best Time to Trade the Japanese Yen |
