
In this series of articles we’re looking at ways to manage risk in volatile market conditions, plenty of which we can probably expect throughout 2015.
Each week we’re providing you with both a strategy to manage risk, and a specific quantitative tool to implement this strategy. Volatility will become something that you have planned and prepared for and have the tools to manage, rather than a wildcard that wreaks havoc on the balance of your brokerage account.
In last week’s article we looked at an example with Apple Inc (AAPL) and a Nasaq Index ETF (QQQ).
We chose these two stocks for a reason – because there is a degree of similarity in their behavior. Apple Inc is a component stock in the Nasdaq Index. We saw how to deal with the problem of unequal volatility between the two, but the chances are that when one becomes volatile so will the other, and when this happens your returns will also become volatile.
STRATEGY #2 – Diversify
Holding these two stocks is not really a good way to diversify because they are correlated. They will both behave fairly similarly most of the time. If tech stocks fall, both will likely decline. This might seem like an obvious point because few people would think that they were well diversified by having just these two holdings in their portfolio.
The risk comes when you don’t know that two things are correlated and the market gets volatile causing losses in both. While volatility might surprise you, the cross correlations in your portfolio shouldn’t. Here’s a very simple quantitative approach to help you to make the right choices to ensure you’re well diversified . . .
TOOL #2 – The Portfolio Correlation Index
Firstly you’re going to need to know how correlated the assets in your portfolio are.
The Pearson Correlation Coefficient will tell you that – you can add it as an indicator in most platforms – TradeStation is what we’re using below.
Make yourself a simple grid with each asset in your portfolio listed across the top and then again down the side. In our example we’re going to use the 10 assets in the IVY Portfolio (which is described in this excellent book by quant fund manager Mebane Faber):
BND – Vanguard Total bond market (4-5 year)
DBC – PowerShares DB Commodity Index
GSG – iShares S&P Commodity-Indexed Trust
RWX – SPDR DJ International Real Estate
TIP – iShares Barclays TIPS (4-8 years)
VB – Vanguard MSCI U.S. Small Cap
VEU – Vanguard FTSE All-World ex-US
VNQ – Vanguard MSCI U.S. REIT
VTI – Vanguard MSCI Total U.S. Stock Market
VWO – Vanguard MSCI Emerging Markets
For each market listed down the side, check how correlated it is with each market along the top. Obviously each market’s correlation with itself will be 1. You’re going to enter the figures into the grid, but you’re going to multiply them by 100 first. This converts them to a percentage (some figures will be negative – that’s fine).
The exception to this is the boxes showing a market’s correlation with itself – just enter zero into these boxes.
You should end up with a grid that looks something like the following (click here to download the Portfolio Correlation Index Calculator as an excel document):
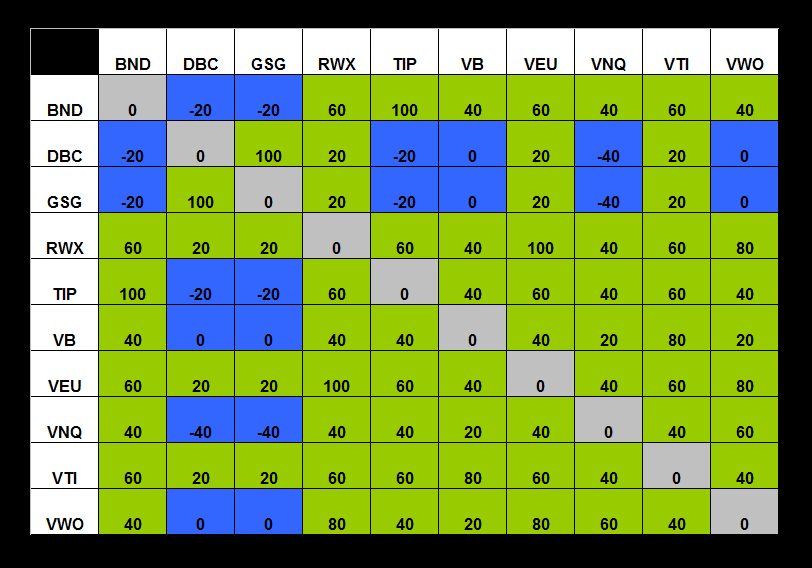
Now you’re going to add up all the figures in the grid, and then divide them by the square of the number of assets in the portfolio less the number of assets in the portfolio.
Sound complicated? It isn’t – take a look at our calculation below for the 10 asset portfolio and it will make perfect sense:
( 0 + -20 + -20 + 60 + 100 + . . . . . . 40 + 0 ) = 3120
3120 / ( ( 10 x 10 ) -10 ) = 3120 / 90 = 34.66
For ease of interpretation we can now turn this into an index by dividing it by two and adding fifty:
( 34.66 / 2 ) + 50 = 17.33 + 50 = 67.33
Interpreting the Portfolio Correlation Index
The figure you’ve arrived at – 67.33 in our example above – is an indicator of the correlation risk in your portfolio.
- A figure close to 50 means that you have little or no cross correlation.
- A figure close to 100 means that you have near 100% correlation and you’re terribly diversified – in fact you might as well just own any one single asset and not bother with the portfolio!
- A figure of less than 50 means that the assets are negatively correlated, and you will benefit from diversification in proportionately.
How do you use this tool?
There are a few ways you can use the Portfolio Correlation Index, and it all depends on how simple (or complicated) you want to make things.
In any case, you’re going to need to determine a threshold value for correlation risk. You might decide, for instance, that when the index rises above 75 the portfolio has become too saturated with correlation risk.
Although there are optimum values for particular desired outcomes, this is like most things when it comes to risk: it will all depend on your own circumstances and your appetite for risk.
How do you react when the threshold value is reached? Here are some possibilities:
 Change the Portfolio Constituents – Start to switch out assets, beginning with the one with the highest net cross correlation. Just total along the row for each asset to see which is contributing the most risk. In our example above we would begin by looking to replace RWX or VEU with something that lowered the overall Portfolio Correlation Index value.
Go to Cash – It’s not always possible to switch out of one market and into another. Certainly professional fund managers are often limited in what they can trade – all major forex pairs, or only government bond futures – even though this mandate might have been of their own original design.
In our example above we may not wish to deviate from the 10 Ivy Portfolio stocks. In situations like this the index can be used to determine an allocation to cash.
One way to do this is to use an inverse of the index figure (simply subtract it from 100) to determine what percentage should be invested. If we have an index of 25 we would be ( 100 – 25 ) = 75% invested and 25% in cash. If the Portfolio Correlation Index rose to 90 we would be ( 100 – 90 ) = 10% invested. Only when there was zero correlation risk in the portfolio would we be fully invested.
Taking it Further
Although moving to cash helps us to reduce our risk in a very definite way, the disadvantage is that by moving money to cash there is a definite opportunity cost.
| View similar articles about investing in stocks: Stocks Knowledge Base |