
There’s little doubt about it – as we suggested in our 3 Non-Predictions for 2015 article – volatility is back!
Whether we’re talking about the Swiss Franc, QE in the Eurozone, or a Fed interest rate hike, the markets are proving quick to overreact to the news . . . especially if it’s bad news.
What can you do to shelter yourself from the volatility storm? By the time you finish reading these articles you’ll have all of the following to enable you to structure your exposure like a seasoned professional:
- 3 powerful strategies for managing risk in volatile market environments
- 3 quantitative tools to implement these strategies with
- A blueprint for integrating all of the above into your trading plan
STRATEGY #1 – Be Adaptive
Everyone likes to think that they’re adaptable, not just in the markets but in everyday life. We associate it with the ability to learn, and picture those who are slow or unable adaptable as those who are likely to be left behind. As the character Marv puts it in ‘Wall Street’: “In 10 minutes it’s history, at 4:00 I’m a dinosaur!“
Unfortunately we tend to confuse adapting with reacting, and few of us have well-defined plans in place for how we respond to volatility and vary our exposure.

The way in which hedge funds and financial institutions manage risk can be extremely complicated for little gain. Maybe unnecessarily so. The pay-off curve certainly flattens out as the amount of effort you put into risk management rises or, to put it another way: adopting just the one simple method that we’re about to discuss should help you enormously.
I’m going to be using stocks in this demonstration, but it doesn’t matter what market you’re involved in – forex, commodities, precious metals . . . Exactly the same method will work whatever it is that you trade.
Understanding the Challenge
Say you have two assets, Stock A and Stock B. Both are priced at $100 per share today, and you have $1000 to invest. How do you divide your investment between the two shares – by splitting it in half and putting $500 in each?
What if I told you that Stock A typically moves up or down by $1 per day, whereas Stock B tends to move around $4 per day?
If you divide your capital in two you will probably, by the end of the first day, have a profit or loss in Stock B that far exceeds your profit or loss in Stock A. It’s obvious why – Stock B is more volatile – it moves around more!
How to Adapt to Volatility
You don’t want the additional volatility of a market to mean that you have to risk a greater loss in it (believe me, you really don’t), you want to equalize your opportunity to profit across each. You need each of your positions to have a near identical chance of making or losing you money.
In the example above this is easy to achieve: Stock B moves around four times more than Stock A, so you want to own four times less of it. You would place $200 in Stock B and $800 in Stock A.
 That all probably seemed incredibly simple and obvious to you, but you just achieved what quantitative money managers term “Risk Parity” – you’ll find it mentioned in their fund prospectuses – it’s one of those sophisticated sounding things that they charge massive management fees for!
Things aren’t always quite so simple as in our example above though, whereby the daily price change in dollars was a basic proxy for risk. Enter a statistical measure taught to high school students . . . Standard Deviation.
Standard deviation is the math at the heart of our first tool for managing volatility – Risk Parity.
TOOL #1 – Risk Parity
Rather than asking how more much one asset moves around in dollar terms than the other, which does not provide a true comparison, we use standard deviation, which as its name suggests, is a standardized measure. Time for a look at a real-world example of achieving Risk Parity . . .
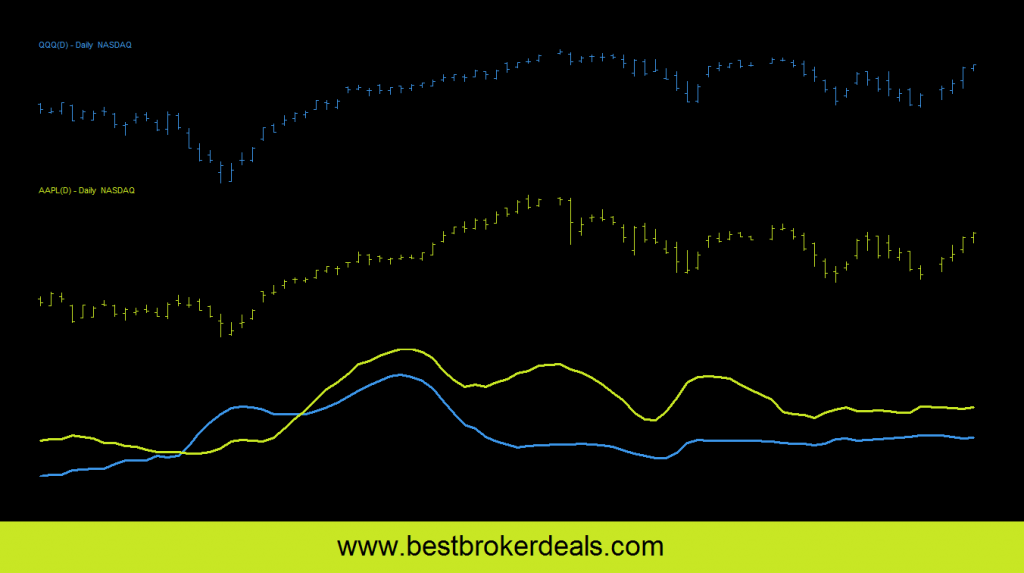
The chart shows two stocks, Apple Inc (AAPL) and the Nasdaq PowerShares ETF (QQQ). Underneath you’ll see the standard deviation of each stock has been plotted. AAPL is generally more volatile in dollar terms QQQ and this is reflected in the fact that its standard deviation is higher throughout the period. At the present time at the right of the chart the deviations are as follows:
StdDev AAPL = 2.53
StdDev QQQ = 1.6
If we wanted to buy shares of each right now we would perform the following calculation:
StdDev AAPL / StdDev QQQ = Ratio of Shares of QQQ to AAPL
2.53 / 1.6 = 1.5812
So for every share of AAPL we would want to buy 1.58 shares of QQQ to equalize our volatility across both.
In our example scenario we have $1000 to invest, so we would spend 1/1.58=0.633 of our capital on QQQ and the remainder on AAPL. The number of shares of each that we could purchase would be:
Capital to spend on QQQ = 0.633 x $1000 = $630
Quantity of shares of QQQ = $633 / share price of $104 = 6 shares
Capital to spend on AAPL = 0.367 x $1000 = $367
Quantity of shares of AAPL = $367 / share price of $113 = 3 shares
By purchasing shares in this ratio, 3 of Apple Inc and 6 of the Nasdaq ETF, we have equalized our volatility risk across both markets.
If you’re trying to achieve Risk Parity for a whole portfolio of different markets you’ll need to use a slightly more complicated formula – we cover this in a ‘Portfolio Risk Management’ article available to subscribers – just complete the signup box at the bottom of the page to access this free of charge.
Taking it Further
Adapting to Volatility through Risk Parity is a great start, but don’t think it will resolve all your risk problems – next week in Weathering the Volatility Storm – Part 2 we’ll be taking a look at what happens when both of the stocks you just equalized decide to move against you in tandem. Join us next time!
| View similar articles about investing in stocks: Stocks Knowledge Base |