
How many times have you panicked when the market has sold off sharply, only to be pleasantly surprised when it rallies to new highs a few days later?
You’ll see all sorts of fundamental explanations for this at the time, and some will even seem to make sense.
But as often as not there will be little apparent rhyme or reason to what happens and no sound explanation for why, only days after a sharp decline, longs suddenly step in with great vigor and buy the market.
A simple explanation for this phenomenon is often nothing more than something that was expensive is now relatively cheap, and people who are interested in buying it now see an opportunity to acquire it at a discounted price. Buyers like to buy low, and the lower the price, the more interested buyers become.
Participants with a long bias tend to see dips in the market as buying opportunities.
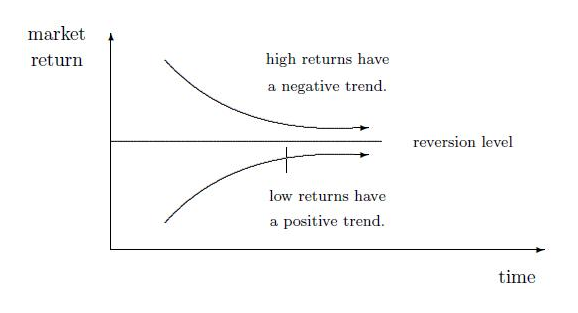
It’s All About Mean Reversion
In mathematical terms, these participants anticipate a reversion to the mean. When prices fall to a relatively significant amount below their average, the resumption is that the will revert back towards it. Unfortunately though, nobody knows just how deep any particular correction will run, and many have had their fingers burnt by buying dips without a well researched quantitative approach.
 In this week’s study, which is intended only as a proof of concept and is not recommended as a viable strategy, we investigate the wisdom of buying dips.
Does buying dips make sense? Does it reduce drawdown or increase profitability when compared to a buy-and-hold strategy? Do equity indices really exhibit mean reversion?
Test Strategy
The Test Strategy commits 1% of capital to a long position when the market has fallen 1% from its all time highs. With a 2% decline the position size is increased to 2% of capital, and so on. 100% of the capital would only be invested if the market were to fall to zero. All positions are exited when the market makes a new high.
Control Strategy
The Control Strategy emulates the returns of a buy-and-hold investor, committing 100% of the capital to a long position at the start of the test period.
Test Parameters
The market we used for testing was the S&P500 index of large cap US stocks, as represented by the SPY Exchange Traded Fund. No slippage, commissions, or other fees were included. Nor were dividend payments considered in the returns shown.
The Test Results
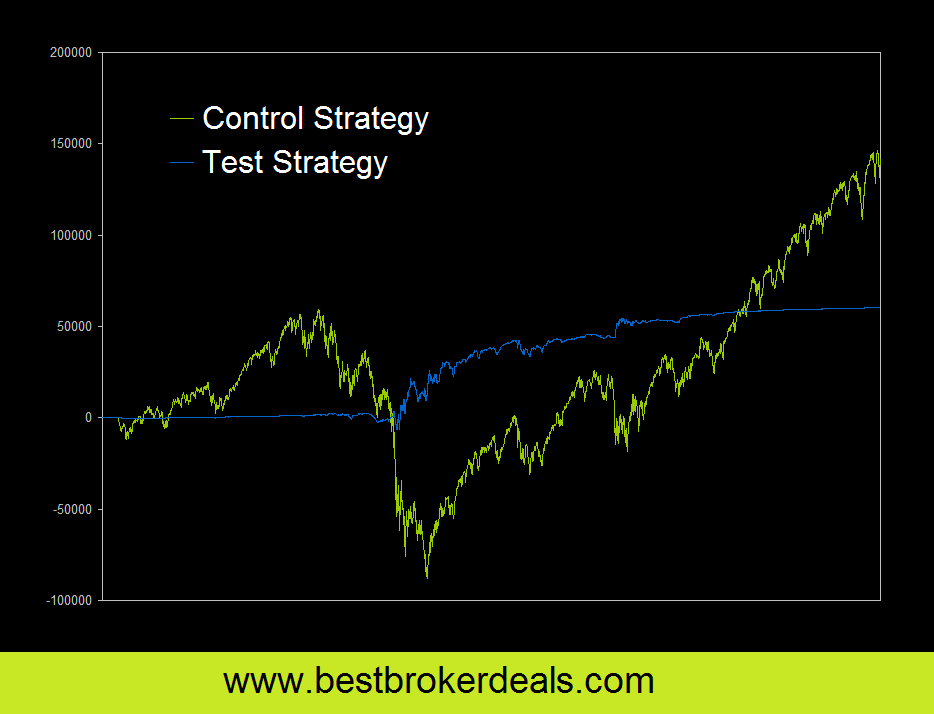
As you can see, over the period shown the Test Strategy produced a return stream that was markedly different to that of the buy-and-hold Control Strategy.
- For the Test Strategy the maximum drawdown was 7.51% of the initial capital, and the net profit was 30.21%.
- The Control Strategy produced a return of 69.37% with a maximum drawdown of 75.32% of the starting capital.
Net profit as a percentage of drawdown is a simple metric that can give us some indication of the risk that was undertaken in order to achieve a return. A higher figure indicates that the strategy could be considered less risky.
- For the Test Strategy this figure was 402.04%, meaning that the closing profits were roughly four times the size of the maximum dollar drawdown incurred.
- The Control Strategy this figure was 90.10%, indicating that the maximum dollar drawdown suffered was actually greater than the closing net profit.
Doubling down has proven to be a ruinous strategy (and in certain situations it is certain to be so), but if sufficient measures are in place to control risk, you needn’t go the same way as Long Term Capital Management. In our example above, our strategy was able to “double down” up to a hundred times, buying dips by scaling into positions to lower the average purchase price.
 But can you be certain that the S&P will never fall to zero? Or more importantly, can you be certain that it will ever again trade to new highs? Of course not, and we wouldn’t recommend the proof of concept above as a viable strategy.
However, this study does offer some evidence to support a tendency for mean reversion in this index, and many good strategies (with far better risk control) such as trading pullbacks in trends can be constructed around this basic concept.
Combining short term mean reversion with the long term momentum of trends is at the core of many of the more profitable directional trading strategies available.
| View similar articles about investing in stocks: Stocks Knowledge Base |