How to Trade Retracements in Trends
 Pullback trading strategies are one of the oldest and most reliable trading styles around. One of the main reasons that this approach works is because it combines the edge of two fundamental market behaviors: the tendency for market prices to undergo sustained trending movements in the long term, and the tendency for price to revert to its mean, or gravitate back towards its average, in the short term. A pullback is just a short term retracement.
The basic trading concept is very simple: identify a trend, wait for price to retrace counter to this trend, and then enter so that you will profit from a movement back in the direction of the original trend. Trends and pullbacks occur in all markets and in all time-frames, so this is an approach that can be adapted to almost any trading style.
Of course, there’s a big difference between understanding a generalized market pattern and knowing how to trade it profitably, when to enter, when to exit, and how to manage risk. The remainder of this article will demonstrate some specific entry and exit techniques along with the types of order you’ll need to place with your broker to exploit these opportunities.
| View similar articles about investing in stocks: Stocks Knowledge Base |
Identify the Trend
Some trend following-funds always have a position in each market they trade. They are always either long or short. Does this mean that they believe that a market is always in a trend, whether up or down? Not really. It just means that they want to ensure that they are well positioned from the very outset when a trend begins.
You Can’t Always Be Right
Markets do not always trend, and the length and behavior of a trend will vary from one market environment to another. The trend-following fund managers know and accept this, and as a trader so must you – you cannot be correct or certain about the trend at all times. Fortunately, being correct just some of the time is still sufficient to make a pullback strategy profitable.
Trend Indicators
There are many complex systems and approaches for determining the current price trend, and also the “strength” of this trend, and we’ve tried them all in! But in all our testing none has proven any more effective than the simple moving average (*well, there is one that is sometimes better – continue reading and we’ll discuss this insight and why we think it works). If you’re not familiar with it, the SMA is a really basic study that you’ll find in any charting package – even free online charts include this indicator.

The SMA has just two inputs, the price that you want an average for and the number of bars over which you want to calculate the average. You can adjust each of these within your charting platform.
The first input should be based on when you intend to trade. If you’re looking at daily bars and plan to trade only on the close, then you should use the closing price, and if you intend to enter all your orders ready for the open then you’ll use the opening price for your average.
The second input is a bit more tricky . . . The most efficient way to find the best historical value for each market you choose to trade would be to backtest your strategy (for this we unreservedly recommend one platform: TradeStation). Failing this, you could analyze 100 periods with your average – it mightn’t be the most optimal setting for a particular market, but it shouldn’t be far off.
Enter Long in an Uptrend and Short in a Downtrend
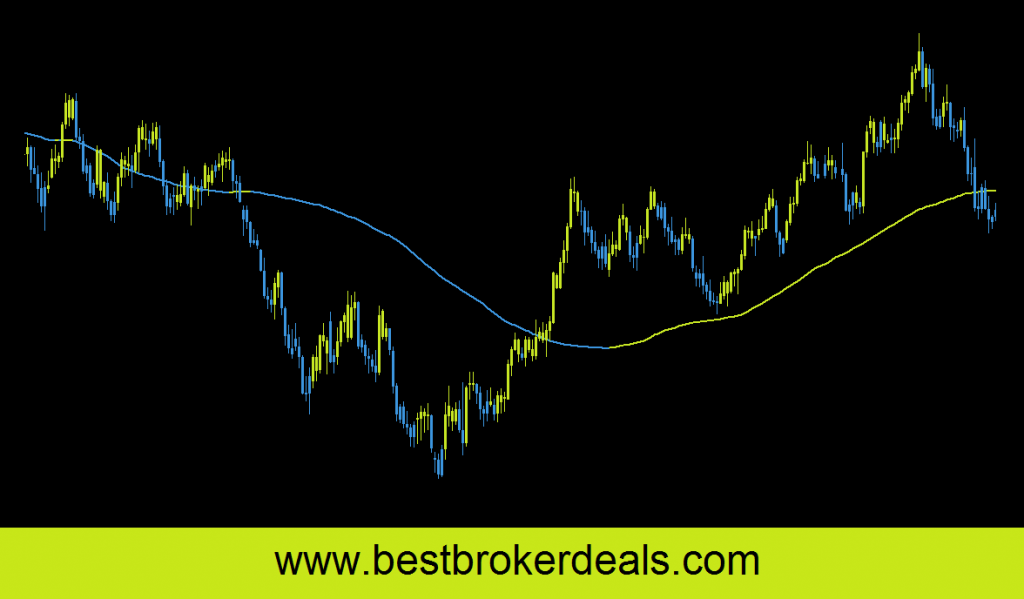
When a market is trading above the SMA then it is considered bullish, and you can look to enter long when a pullback occurs; conversely, if price is below the average then a downtrend is underway, and you will wait for short entries on pullbacks in this trend.
Not All Pullbacks Are Equal
Once you know whether the trend is up or down the next step is to await a pullback setup for entry – but how can you objectively identify a pullback? Not all pullbacks are the same – some are shallow and last just a few bars, where others are significant retracements that can last weeks – how do you navigate this as a trader?
Objective Methods for Identifying Pullbacks
Let’s have a look at some simple quantitative methods for identifying pullbacks . . .
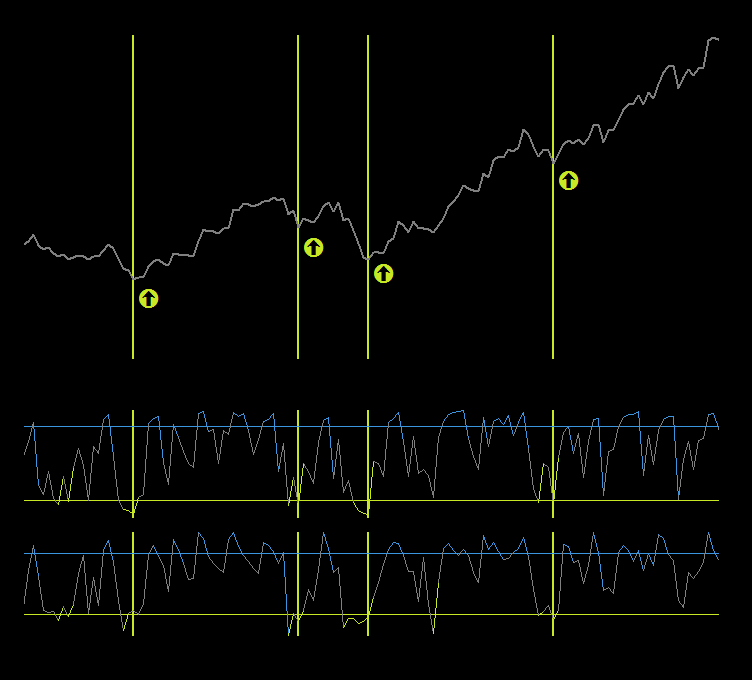
In essence, a pullback should cause any type of overbought/oversold oscillator to move to an extreme value. To identify the short three or four bar retracements that characterize strong trends, you’ll want to use a fairly short setting for these indicators – this will make them sensitive enough to move to an extreme level during a pullback.

The chart above shows the Euro (EUR/USD) with two oscillators that you could use to identify pullbacks: the Relative Strength Index and the Commodity Index Channel. Can you see how both are showing pretty much the same thing? Both identify the same oversold pullback when the market is in an uptrend. Other oscillators you might consider include the Stochastic and the Value Chart.
In our testing the Relative Strength Index (RSI) has proven a strong performer, so for the rest of the article we’ll be using this indicator with a look-back of 2 periods.
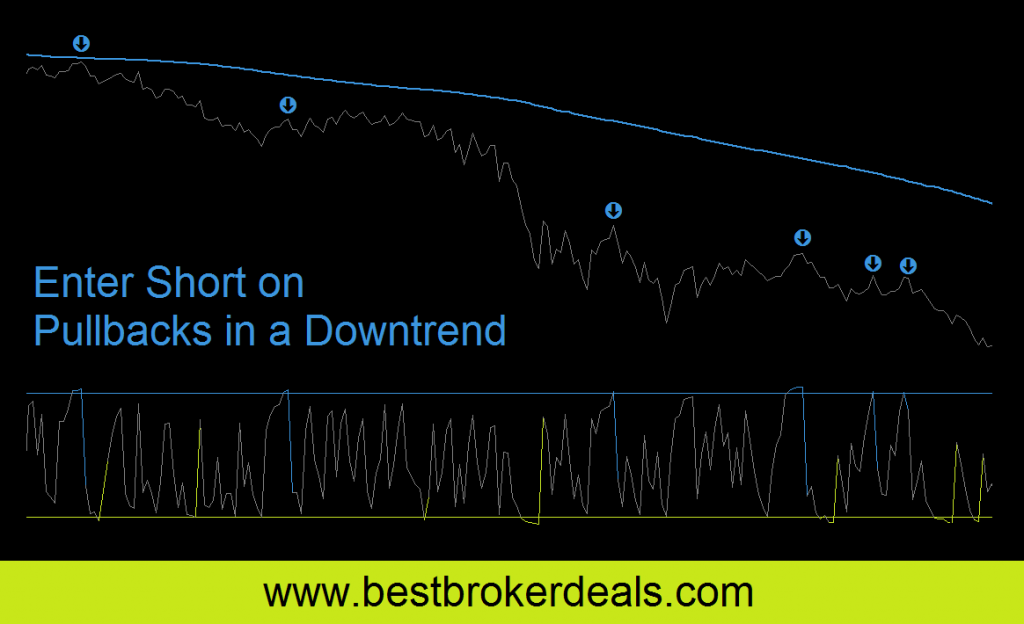
Now take a look at the daily chart below. This shows the S&P during the sell-off of the sub-prime crisis throughout 2008. The market is trading below a 200 period average, and with each brief rally the RSI(2) oscillator becomes overbought, providing an opportunity to short.

But where exactly should you be getting short? There are two possible options, and we’ll look at them both in the next section . . .
Pullback Entry Setups
The main difficulty with trading a retracement is that you never know how deep it will run. If you enter after a couple of down bars expecting an uptrend to resume, you may well get into trouble if the market continues to fall. But if you wait only for significant pullbacks what about all those missed opportunities when the market retraces just a little?
There is no easy answer to this dilemma, but you can choose to adopt one of two basic strategies.
Strategy A: Trade Into the Pullback
The first approach is to buy into the pullback, as the market falls. If you’re swing trading this will normally mean buying a market after it has declined for several days, and if you’re daytrading it will require that you place a limit order under a rising market that is filled only if price starts to fall.
One easy way to do this is to buy (in an uptrend) when an RSI(2) falls below a threshold value such as 1o, and to sell short (in a downtrend) when an RSI(2) rises above a threshold value such as 90.
The advantage of this approach is that you will enter the market that you hope to rise (or fall) at a better price. If the pullback ends as hoped and the trend resumes, you will have more opportunity to profit. The disadvantage is that you could be buying (or selling) into a pullback that is far from bottoming out, or even into a full scale reversal.
Rest assured, this approach can work well, though it requires guts and a contrarian instinct (it’s what many floor traders made their living doing), but you’ll need to control your risk and understand how returns will be distributed (lots of smaller wins and occasional larger losses).
Strategy B: Trade a Resumption of the Trend
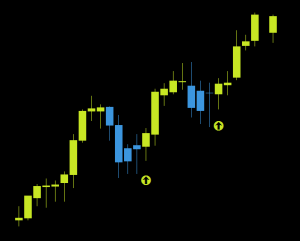
A second method is to enter a market only once the uptrend resumes. How do you know when this has happened? There is no definitive answer – you are simply looking for a move back in the direction of the original trend to confirm that it is still intact. Common setups that traders look for are:
- An up-closing bar
- A breach of the high of the prior bar
- A bar that closes higher than the one preceding it
- A breach of the former high made prior to the pullback
For clarity, each of these has been marked on the chart above.
Generally speaking these positions would be initiated using either a market order when the close of a bar satisfied the condition for entry, or a stop order (a buy stop or a sell stop).
The advantage of using this entry strategy is that you won’t get dragged into a falling market way too soon – price will need to confirm that the uptrend is resuming before your order is filled. The disadvantages include the fact that the market may give false confirmation (a pullback within a pullback!) and reverse once more, and more importantly, that in waiting for confirmation you will concede a significant proportion of your opportunity to profit.
Trading Pullbacks for Profit
However you choose to trade this omnipresent market pattern, and in whatever time frame, we’ll leave you with the following equity curve. This shows the results of buying a pullback (RSI(2) below 5) in an uptrend (market closes above 100 period SMA) in the S&P over the last 15 years.
*Earlier in this article we suggested that there is sometimes a more efficient method of trend identification than the one we described. Most often useful in the kind of ‘noisy’ market environments that daytraders encounter, it is occasionally better to pay attention to the slope of the simple moving average rather than whether price is above or below it. You would be well advised to test whether this approach is more profitable for your strategy before employing it.
